I often use bom.gov.au and their wind readings and "wind rose" pdf by postcode.
If you want a detailed graphic chart history timeline (at least on land or coast) by graph including all data, try this (wait for the page to load properly)
weatherspark.com/;a=Australia/NSW/Wollongong
various increments to the graph.
Use the "graph" menu button in the top right corner to set the information you want on the timeline.
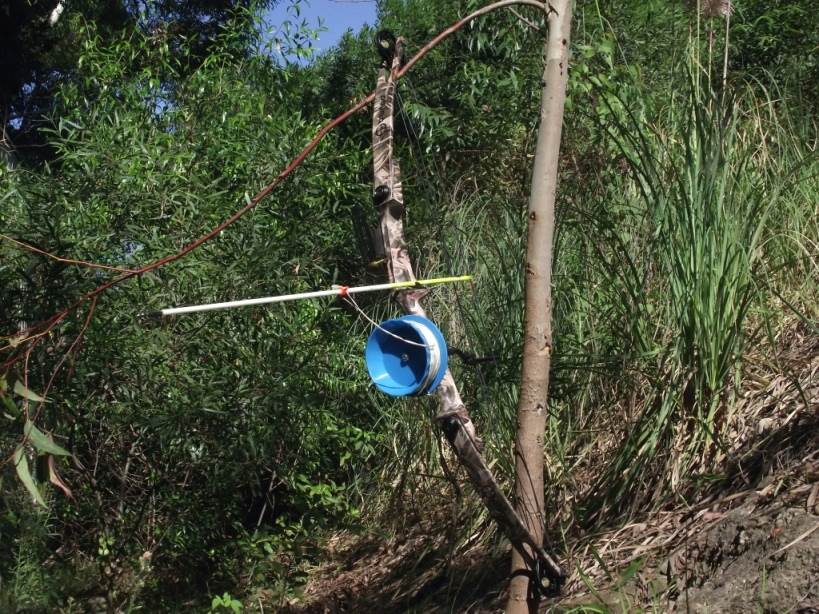
Good one for knowing how far off line my arrow will go on a long shot for bowfishing.
Thinking a stable paddle board or stand up kayak is a good easy way out beyond land.