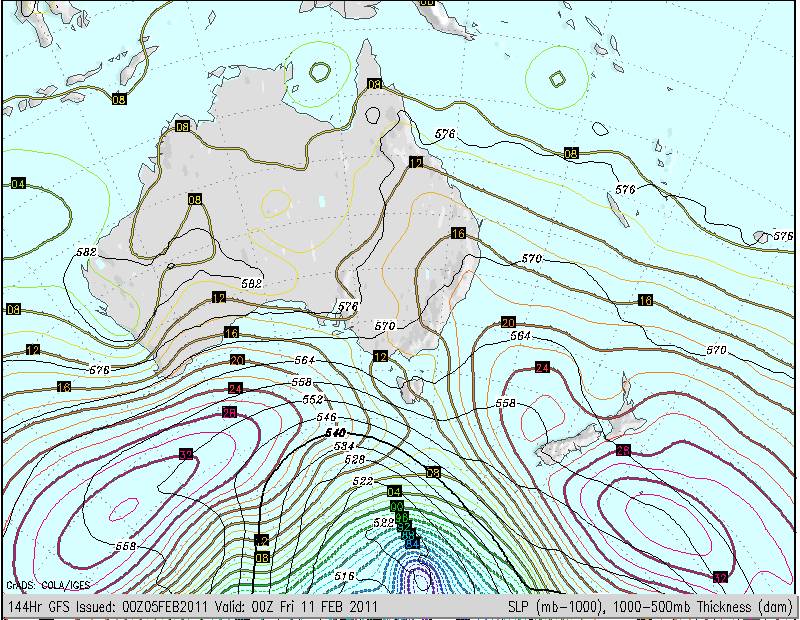
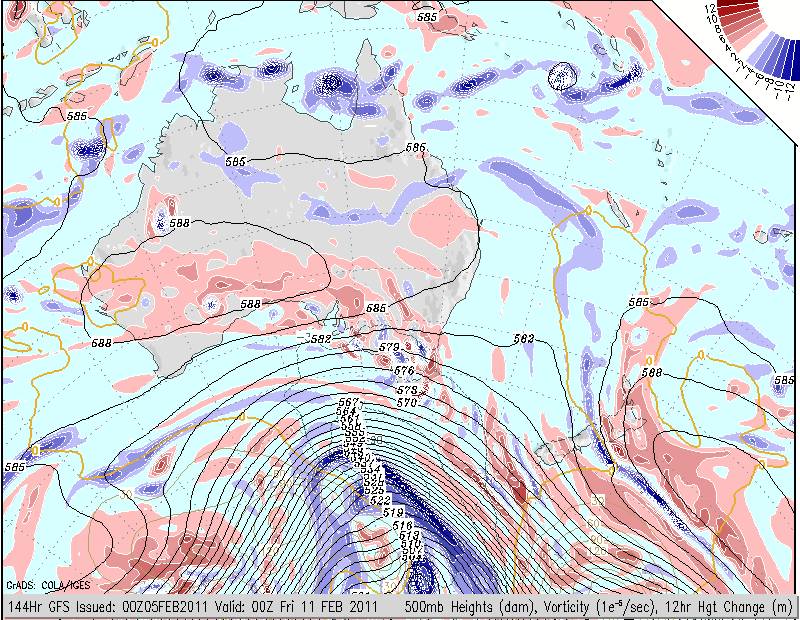
Mr Float, I hope your wrong, but this is latest map for 6 days out and it looks like the possibility of two tropical lows forming, one in the coral sea, and the other in the Gulf of Carpentaria. I can't even imagine how bad it would be if another cyclone hit QLD! From the vorticity chart you can see the two lows forming alot of rainfall.
Here's a guide of how to read these charts.
Panel 1
500mb Geopotential Heights, Height Change and Vorticity
Black contours indicate the geopotential height of the 500 millibar surface, in tens of meters.
Low geopotential height (compared to other locations at the same latitude) indicates the presence of a storm or trough at mid-troposphere levels.
Relatively high geopotential height indicates a ridge, and quiescent weather.
In the forecast panels, the colored contours indicate the change in geopotential height during the 12 hours leading up to the valid time.
Decreasing geopotential height usually indicates an approaching or intensifying storm.
Increasing heights usually indicate clearing weather for the period.
The color shading indicates vorticity at 500 millibars: Red for positive vorticity, blue for negative.
Positive vorticity indicates counterclockwise rotation of the winds, and/or lateral shear of the wind with stronger flow to the right of the direction of flow.
Negative vorticity indicates clockwise rotation of the winds, and/or lateral shear of the wind with stronger flow to the left of the direction of flow.
Positive (or negative in the Southern Hemisphere) vorticity at 500 millibars is associated with cyclones or storms at upper levels, and will tend to coincide with troughs in the geopotential height field.
Negative (positive in SH) vorticity is associated with calm weather, and will tend to coincide with ridges in the geopotential height field.
Panel 2